Predictive Maintenance Software: How It Actually Works
Predictive maintenance software ingests vibration, current, and thermal telemetry to forecast equipment failures across the P-F interval. This guide covers the ISO 13374 architecture, edge FFT feature extraction, RUL modeling, and CMMS work-order automation.

On this page
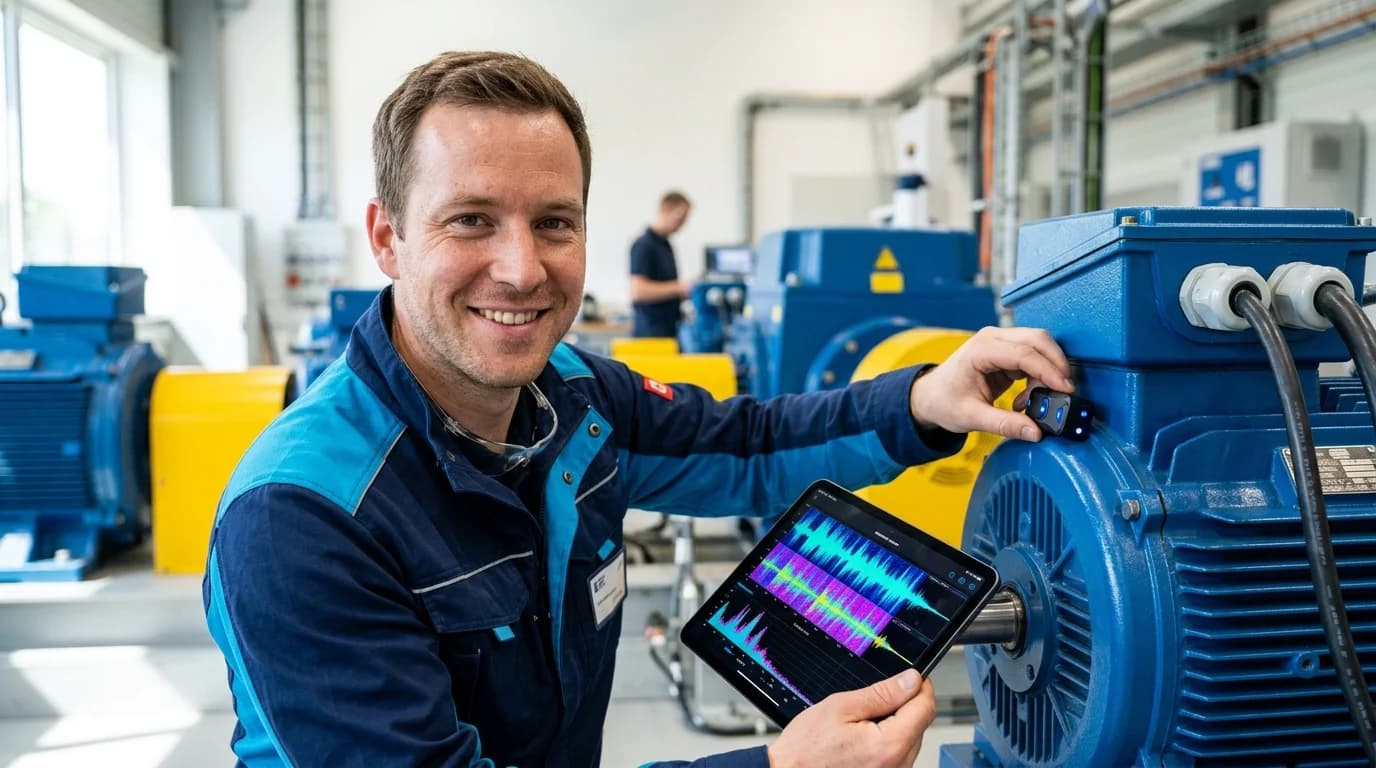
Predictive maintenance software is an industrial analytics and execution system that continuously monitors the physical health of production machinery. It reads vibration spectra, motor current signatures, acoustics, thermography, and lubricant condition to detect early component degradation, then schedules repairs inside planned downtime windows before a breakdown happens. Rather than servicing machines on arbitrary calendar intervals or waiting for a spindle to seize mid-shift, predictive maintenance (PdM) software models where each critical asset sits on its degradation curve and triggers a parts-ready work order in the maintenance system weeks ahead of functional failure.
Most vendor brochures present predictive maintenance as an AI black box that ingests raw sensor numbers and predicts exact failure dates on day one. Wire accelerometers to a 20-year-old stamping press and you'll find it doesn't work that way. Without operating context from the PLC (spindle RPM, load torque, active product recipe), a machine learning model mistakes a heavy roughing cut for a failing bearing. How predictive maintenance software works in practice comes down to five things: the ISO 13374 six-stage processing pipeline, sensor physics across the P-F curve, edge Digital Signal Processing (DSP) and Fast Fourier Transform (FFT) bearing kinematics, Remaining Useful Life (RUL) modeling when failure labels are scarce, and closed-loop integration with your CMMS software and MES.
The short version
- ISO 13374 six-stage architecture: Production PdM software follows ISO 13374 from high-frequency Data Acquisition and Edge DSP Manipulation through State Detection, Health Assessment, Prognostics (RUL), and automated CMMS Advisory Generation.
- P-F curve physics dictate modality: Ultrasonic demodulation and FFT envelope vibration catch bearing race spalling roughly 4 to 12 weeks before failure (a planning range, not a guarantee), motor current signature analysis (MCSA) catches rotor bar and coupling faults in the cabinet, and thermal rise confirms late-stage friction.
- Edge DSP beats raw cloud streaming. Sampling a tri-axial accelerometer at 25.6 kHz generates about 20 GB/day per sensor, so edge gateways compute velocity RMS, kurtosis, crest factor, and bearing fault frequencies (BPFO, BPFI, BSF, FTF) locally and send compact feature vectors over MQTT Sparkplug B.
- Context-conditioned anomaly detection first: Because confirmed run-to-failure histories are rare in a single plant, deployments start with ISO 20816 vibration limits and recipe-conditioned anomaly models trained on healthy runs, evolving to Weibull and survival/RUL models as teardown labels accumulate.
- CMMS automation without alert fatigue: Joining condition telemetry with PLC states over OPC UA suppresses false alarms during cold starts and changeovers. The result is one idempotent CMMS work order with the suspect component and reserved spare part.
- Start with the bottleneck assets whose breakdowns halt the line, often 10% to 20% of the registry. That's typically where OEE Availability gains show up first.
The ISO 13374 six-stage predictive maintenance software architecture
To prevent condition monitoring tools from turning into isolated data silos, ISO 13374 (Condition monitoring and diagnostics of machines) and the MIMOSA Open System Architecture for Condition-Based Maintenance (OSA-CBM) standardize predictive maintenance software into six sequential functional blocks.
- Block 1: Data Acquisition (DA): Converts physical machine phenomena (housing acceleration, magnetic flux, acoustic pressure, infrared radiation) into calibrated digital time-series waveforms that carry asset topology IDs and timestamps synchronized over IEEE 1588 PTP.
- Block 2: Data Manipulation (DM) / Signal Processing: Executes anti-aliasing filtration, Hanning windowing, high-frequency envelope demodulation, Fast Fourier Transforms (FFT), and time-domain statistical compression (
RMS,Peak-to-Peak,Kurtosis,Crest Factor) on the edge IPC or smart sensor gateway. - Block 3: State Detection (SD): Joins the extracted spectral features with real-time operational context from the PLC (
Spindle_RPM,Motor_Load_Pct,Active_Recipe_ID,PackML_State) and evaluates whether the asset is within its normal operating envelope. - Block 4: Health Assessment (HA) / Diagnostics: Classifies the specific fault mechanism and severity grade, separating shaft unbalance (
1x RPM) from angular misalignment (2x RPMaxial) or an inner-race bearing spall (BPFIsidebands). ISO 18436-2 sets the qualification requirements for the vibration analysts who review these calls. - Block 5: Prognostics Assessment (PA): Projects the degradation trajectory forward under planned production loads from production planning software to estimate Remaining Useful Life (RUL) with confidence intervals (e.g., 180 ± 35 operating hours to critical ISO 20816 Zone D boundary).
- Block 6: Advisory Generation (AG): Translates the prognostic window into an executable maintenance action: checking spare-part inventory in manufacturing inventory software, creating a prioritized work order in the CMMS, and recommending a repair window before the next scheduled campaign.
Predictive maintenance vs preventive and condition-based: RCM, SAE JA1011, and the P-F curve
Predictive maintenance forecasts time to failure from condition data. Preventive maintenance services an asset on a fixed interval, and condition-based maintenance reacts when one sensor crosses a threshold. Which of the three an asset gets depends on how critical it is and how it fails.
No factory should put $1,500 tri-axial piezoelectric accelerometers and RUL models on an exhaust fan that costs $180 and takes 20 minutes to swap. Under SAE JA1011 (Evaluation Criteria for Reliability-Centered Maintenance Processes) and ISO 17359:2018, maintenance engineering starts by segmenting the asset registry by Failure Effect Criticality and Failure Mode Physics.
The split between age-related and random failures comes from the original RCM research. Nowlan and Heap's 1978 study of United Airlines aircraft components found that only about 11% to 18% of failure modes showed an age-related wear-out pattern. That's the kind of failure (refractory lining erosion, filter clogging, sacrificial anode depletion) where fixed-interval Preventive Maintenance (PM) works well. The remaining 82% to 89% showed random or infant-mortality hazard rates. Those figures come from aircraft, so treat them as directional for plant equipment. The U.S. Department of Energy (DOE) Operations & Maintenance Best Practices Guide draws on the same RCM work.
For random failure modes, opening a healthy gearbox on a 6-month calendar schedule can raise failure probability, because every intervention risks seal damage, contamination, or bolt-torque errors.
The P-F interval: why early detection buys weeks of scheduling lead time
Instead of calendar age, predictive maintenance exploits the P-F curve. Once a physical stress initiates a subsurface micro-crack at Point P (Potential Failure), the defect progresses through distinct physical stages before reaching Point F (Functional Failure):
Ultrasonic stress waves show up first, roughly 8 to 12 weeks before failure. High-frequency envelope vibration follows at about 4 to 8 weeks, velocity RMS vibration at 1 to 3 weeks, and audible noise and heat only in the last hours or days.
These windows are typical planning ranges. The real interval varies with defect type, load, and speed.
The Net P-F Interval (T_PF - T_response) must be longer than the sum of spare-part procurement lead time and the time until the next planned production stop. If a specialty spindle bearing has a 3-week supplier lead time, a thermal sensor that only flags the bearing 6 hours before seizure gives you an emergency shutdown and nothing you can plan around. You need high-frequency envelope vibration or ultrasound that detects the spall 6 weeks out.
Aviation maintenance operates under strict regulatory airworthiness directives for these same prognostic models; see our companion breakdown on predictive maintenance for aircraft for how aerospace MROs validate RUL algorithms, our guide to aircraft maintenance software, and Geotab vs Samsara for SAE J1939 and EV battery fault diagnostics across commercial vehicle fleets.
Predictive maintenance sensors and bearing fault physics: what the software actually measures
To diagnose which component inside a machine is failing (so the technician brings the right bearing or coupling to the line), predictive maintenance software relies on five primary sensor modalities and deterministic mechanical kinematics.
1. Tri-axial vibration and bearing fault frequency kinematics (BPFO, BPFI, BSF, FTF)
Vibration analysis is the workhorse of rotating machinery diagnostics. Every rolling-element bearing has four characteristic fault frequencies determined by shaft rotational speed (f_r, in Hz or RPM ÷ 60), number of rolling balls or rollers (N_b), rolling element diameter (d), pitch diameter (D), and contact angle (θ).
Ball Pass Frequency Outer Race (BPFO), Ball Pass Frequency Inner Race (BPFI), Ball Spin Frequency (BSF), and the Fundamental Train or cage frequency (FTF) work out as:
BPFO equals half the roller count, times shaft speed, times one minus the diameter ratio times cos θ. BPFI uses the same expression with a plus sign instead of the minus. BSF equals pitch diameter divided by twice the roller diameter, times shaft speed, times one minus the square of (roller-to-pitch diameter ratio times cos θ). FTF equals half the shaft speed times one minus the diameter ratio times cos θ, where the diameter ratio is d divided by D.
When a microscopic pit forms on the outer race of an SKF or Timken spindle bearing, every ball rolling over that pit produces a brief high-frequency metallic impact ring (typically between 2 kHz and 20 kHz) repeating at exactly BPFO Hz. Standard low-frequency velocity RMS (10 Hz to 1,000 Hz, governed by ISO 20816-1 and ISO 20816-3) barely budges during early spalling because the impact energy is tiny compared to overall machine vibration.
To catch the fault 8 weeks early, the software executes High-Frequency Envelope Demodulation (PeakVue / gSE): bandpass-filtering the raw acceleration waveform around the bearing's structural resonance (5 kHz to 15 kHz), rectifying the signal via a Hilbert transform to extract the impact envelope, and running an FFT on that envelope. When a sharp spectral peak emerges at BPFO and its harmonics (2x BPFO, 3x BPFO), the software names the exact bearing race weeks before temperature or overall velocity rises.
2. Motor Current Signature Analysis (MCSA)
Mounting accelerometers inside a submerged pump, a sealed hermetic compressor, or a high-temp furnace fan is physically difficult. Motor Current Signature Analysis (MCSA) clamps Hall-effect or Rogowski current transformers (CTs) safely inside the Motor Control Center (MCC) electrical cabinet.
- Broken rotor bars and end-ring cracks modulate the stator current at slip-frequency sidebands around the 50/60 Hz line frequency, at
f_rotor_bar = f_line * (1 ± 2 * k * s), wheresis motor slip andk = 1, 2, 3, ... - Stator winding turn-to-turn shorts, phase unbalance, and gearbox torque oscillations also imprint distinct sidebands in the current spectrum, making MCSA the lowest-friction retrofit for electric drive trains.
3. Ultrasonic acoustic emission (20 kHz to 100 kHz)
Airborne and structure-borne ultrasound sensors listen around 30 kHz to 40 kHz. In bearings, ultrasound detects early lubrication film breakdown and boundary friction before micro-spalling even begins. That lets automated grease dispensers inject exact gram shots without over-greasing and blowing the seal. Across the wider plant, ultrasonic sensors detect compressed-air, steam-trap, and vacuum leaks. In a poorly maintained system, leaks can waste 20% to 30% of compressor output, according to the DOE compressed air sourcebook.
4. Infrared thermography and RTD temperature profiling
Resistance Temperature Detectors (PT100 RTDs), thermocouples, and fixed radiometric LWIR thermal cameras track heat dissipation. On mechanical bearings, a 15°C housing temperature rise usually sits late on the P-F curve (Stage 3/4 warning). On electrical switchgear, busbars, VFD cabinets, and induction sealing heads, however, continuous thermal imaging catches high-resistance loose lugs and failing contactors weeks before an arc flash or breaker trip.
5. Online oil dielectric, viscosity, and ferrous particle counters
For heavy hydraulic stamping presses, injection molding machines, and large reduction gearboxes, inline lubricant sensors measure kinematic viscosity, relative moisture saturation (% water-in-oil), dielectric constant (oxidation), and inductive ferrous/non-ferrous wear-debris particle counts per ISO 4406 cleanliness codes.
Edge DSP vs cloud streaming for predictive maintenance: solving the 20 GB/day bottleneck
Edge DSP means computing vibration features on a local gateway and sending only compact feature vectors to the cloud. That cuts raw waveform traffic from about 20 GB/day per sensor to kilobytes.
Streaming raw continuous vibration waveforms straight to AWS or Azure is one of the quickest ways to blow an industrial IoT budget.
Do the bandwidth math:
- One tri-axial accelerometer sampled at 25.6 kHz (25,600 samples/sec × 3 axes × 3 bytes/sample) produces 230.4 KB/sec (1.84 Mbps), or 19.9 GB per day for a single bearing housing.
- Across 100 monitored assets in a plant, raw continuous streaming generates about 2 terabytes of data a day. That saturates plant subnets and runs up cloud ingest and storage bills for data that is almost entirely healthy background hum.
A production predictive maintenance architecture splits processing between the Edge DSP Node and the Central Historian / ML Platform:
- Duty-Cycled Burst Sampling & Continuous Edge Feature Extraction: Wireless MEMS sensors sample a 2-to-4-second high-frequency waveform burst every 15 to 60 minutes (or continuously on wired IEPE channels for critical high-speed spindles). On the local DIN-rail edge gateway, a C++/Rust DSP worker applies a Hanning window, runs a 4,096-point or 16,384-point FFT, and computes 25 to 40 scalar features per burst:
- Time-domain features: Acceleration RMS (g), Velocity RMS (mm/s, 10 Hz-1 kHz per ISO 20816), Peak-to-Peak, Crest Factor (Peak ÷ RMS, which spikes during early spalling before RMS rises), Kurtosis (4th statistical moment measuring impulsiveness), and Skewness.
- Frequency-domain spectral bands: Energy at
1x RPM,2x RPM,3x RPM, gear-mesh frequency, and demodulated envelope amplitudes at BPFO, BPFI, BSF, and FTF normalized by real-time shaft RPM read from the PLC VFD tag.
- Exception-Triggered Raw Waveform Uploads: Every 5 to 15 minutes, the edge gateway publishes only the compact 2 KB JSON/Protobuf feature vector over MQTT Sparkplug B (cutting bandwidth by more than 99.9%). Full raw 25.6 kHz time-waveform captures are uploaded to object storage only when an anomaly score crosses a warning threshold or once a day as a reference snapshot for vibration analysts.
From threshold alarms to Remaining Useful Life (RUL): modeling with scarce failure data
The hardest machine learning problem in manufacturing is label scarcity. Benchmark datasets like the NASA Prognostics Data Repository (C-MAPSS turbofan engine degradation and IMS/FEMTO bearing run-to-failure sets) provide clean run-to-failure trajectories because engines and test rigs were intentionally run until destruction. In a real factory, maintenance teams replace noisy bearings before catastrophic failure, and historical CMMS tickets often say "Replaced motor bearing - runs OK" without recording which bearing failed or why.
To deliver value in month two rather than waiting three years for training labels, we deploy a three-tier modeling progression consistent with NIST's PHM4SM work on prognostics for manufacturing:
Tier 1 (Day 1 to Month 2): Physics-informed ISO 20816 zones and bearing harmonic rules
Before any ML model finishes training, every instrumented machine is protected by deterministic physics rules:
- ISO 20816-3, which replaced ISO 10816-3 and covers industrial machines above 15 kW running at 120 to 30,000 r/min, classifies machinery by power rating and foundation rigidity (rigid vs flexible) into four vibration velocity RMS zones: Zone A (newly commissioned), Zone B (acceptable for unrestricted long-term operation), Zone C (unsatisfactory for long-term continuous run; schedule repair), and Zone D (vibration severe enough to cause damage; trip or shut down).
- Simultaneously, order-tracked envelope FFT bands monitor known bearing geometry ratios (BPFO/f_r, BPFI/f_r). This gives maintenance diagnostic protection on day one.
Zone D describes damage-level vibration in the standard. The trip setpoint itself is a plant decision.
Tier 2 (Month 2 to Month 6): Recipe-conditioned multivariate anomaly detection
Static thresholds fail on variable-speed or multi-recipe machines: a CNC roughing inconel at 4,000 RPM vibrates 3x harder than when finishing aluminum at 12,000 RPM.
- We partition historical edge feature vectors by operating regime (
Recipe_ID,RPM_Bucket,Load_Torque_Bucket,Machine_State == Execute) pulled from the MES and PLC. - For each operating regime, an unsupervised/semi-supervised model (Mahalanobis distance, Isolation Forest, or a variational autoencoder) learns the joint covariance across vibration bands, motor current, and bearing temperature over 4 to 8 weeks of healthy operation.
- The model outputs a normalized Health Index HI(t) in [0, 1]. Because the baseline is conditioned on the active recipe and load, changing products no longer triggers false alarms.
Tier 3 (Month 6+): Degradation state-space tracking and Remaining Useful Life (RUL)
Once an asset's Health Index HI(t) departs from its healthy baseline and enters monotonic degradation, the prognostics engine fits a stochastic degradation model (such as a Wiener process with drift, a Gamma process for strictly monotonic wear, a Proportional Hazards / Weibull survival model, or a Temporal Convolutional / LSTM network for fleet assets) to the trailing feature trajectory. In the proportional hazards form, the hazard is h(t | x(t)) = h_0(t) * exp(γ^T * x(t)).
Here h_0(t) = (k / η) * (t / η)^(k - 1) is the baseline Weibull hazard rate with shape k and scale η, γ holds the covariate coefficients, and x(t) is the live spectral feature vector (such as demodulated BPFO dB amplitude and kurtosis). Integrating the trajectory against the planned work-center load schedule from production planning software yields a probabilistic Remaining Useful Life distribution (P10 / P50 / P90 hours remaining until Zone D boundary), telling the planner whether the bearing will survive until next Thursday's scheduled die change.
A vibration sensor without PLC context is a false-alarm generator. If your anomaly model does not know that the press just switched from a 2-millimeter aluminum stamping job to a 6-millimeter high-strength steel job, it will page the maintenance lead every time production changes recipes. Joining high-frequency sensor features with OPC UA machine state and recipe tags is what turns noisy waveforms into maintenance tickets technicians actually trust.
The same join-context-first pattern applies outside the maintenance shop. In our supply chain management software project, we unified inventory, order, and compliance data on one data layer, which is the groundwork PdM needs before any model runs.
Closing the loop: automated CMMS work orders without alert fatigue
Closing the loop means every confirmed degradation trend ends as one scheduled, parts-ready work order in the CMMS. An anomaly chart on a monitor that nobody checks doesn't prevent breakdowns. Block 6 of ISO 13374 (Advisory Generation) closes the loop into your CMMS software and manufacturing ERP with four anti-fatigue guardrails:
- Operating-state gating: Suppress vibration and thermal spikes during startups, jog modes, tool changes, or washdowns by checking PLC state via OPC UA Alarms & Conditions.
- Persistence windows: Require a spectral feature or Health Index breach to persist across K of M active bursts (e.g., 4 of 5 bursts over 2 hours) before escalating.
- Idempotent CMMS work orders: Query the CMMS API by
asset_idandfault_codebefore ticket creation; if an open job exists forSpindle_02 / Drive-End Bearing, append the updated RUL estimate and FFT plot instead of creating duplicate work orders. - MRO spare reservation and technician feedback: Link the asset BOM in manufacturing inventory software to reserve the exact replacement bearing (
SKF-7014-CD/P4A), and capture a structured 10-second close-out tag (Confirmed Spall,Misalignment,Loose Sensor, orFalse Alarm) to feed ground-truth labels back into the model.
Build vs buy predictive maintenance software in 2026
Buy turnkey predictive maintenance software for standard balance-of-plant assets. Build when PLC and recipe context decides the diagnosis, which is the usual case on custom production machinery.
Scoping a 90-day predictive maintenance rollout
Start with the downtime Pareto in your OEE and quality management software logs rather than buying 500 sensors:
- Weeks 1 to 3: Select the top 10 to 20 bottleneck assets and match failure modes to sensor physics (IEPE vibration for variable-speed spindles, MCSA clamps in the MCC, oil counters for presses).
- Weeks 4 to 8: Deploy edge DSP gateways computing ISO 20816 and bearing FFT bands joined with PLC speed, load, and PLM software / MES recipe tags over OPC UA and Sparkplug B.
- Weeks 9 to 12: Train recipe-conditioned baselines, wire idempotent CMMS work orders, and enable technician close-out tagging.
Whether integrating diagnostics into a smart factory historian, modeling 10,000-device MQTT and time-series unit economics with our IoT app development cost ledger, or building a custom platform via our custom software development and AI software development practices, our manufacturing software development team engineers PdM systems from edge FFT pipelines to closed-loop work orders.
Augury vs Falkonry vs Siemens Senseye: 36-month PdM cost and custom build tiers
Reliability leaders scoping predictive maintenance software across 400 critical rotating assets (motors, pumps, compressors, and variable-speed CNC spindles) are choosing in a changed vendor market. Amazon closed AWS Monitron to new customers on October 31, 2024, though existing customers can keep using it, and retired its companion ML service Amazon Lookout for Equipment on October 7, 2026. Plants that planned around those services need another route. Enterprise RFPs typically weigh three commercial suites against an owned ISO 13374 / ISO 20816-3 industrial PdM stack: IEC 62541 OPC UA and MQTT Sparkplug B ingestion, C++/Rust edge FFT envelope analysis, TimescaleDB, ONNX RUL scoring, and automated CMMS software work-order dispatch.
- When commercial PdM products win: Choose Augury when a facility with no internal reliability or OT engineers wants turnkey monitoring on 30 to 60 constant-speed HVAC chillers, fans, and water pumps. Choose Falkonry when process engineers want rapid anomaly discovery over existing OSIsoft PI historian streams, or Siemens Senseye when a global conglomerate already standardized on Siemens Industrial Operations X wants a top-down executive health dashboard.
- Where per-asset pricing gets expensive: Across 400 rotating assets, an assumed $45 to $55+ per asset per month ($216,000 to $264,000 a year) adds up to roughly $650,000 to $800,000 in subscriptions over 36 months, or about $0.9M to $1M once ops are included. That spend still doesn't join PLC recipe states on variable-speed CNC spindles or presses. You also stay exposed if a vendor closes a product line, the way AWS closed Monitron to new customers.
The worked 36-month industrial PdM software & monitoring TCO matrix covers 400 critical rotating assets (motors, pumps, compressors, and CNC spindles) across 2 plants. Open-standard IEPE / IO-Link accelerometer purchase CapEx on non-bundled columns is amortized separately at asset commissioning, so 36-month software, DSP, and ops costs compare cleanly.
Vendor prices in this table are illustrative modeling assumptions, not published list prices. Augury, Falkonry, and Siemens quote per contract, so swap in your own quotes before you rely on the totals.
In this model, over 36 months across 400 critical rotating assets, owning an open-standard IEC 62541 OPC UA, MQTT Sparkplug B, edge FFT, and TimescaleDB PdM stack built in CEE saves $572,300 against Siemens Senseye, $602,300 against Falkonry, and $639,300 against Augury, and rolling out to your next 400 assets adds no software license cost.
Idealogic's 2026 industrial PdM engineering tiers compare senior CEE manufacturing and AI software development squads at $75/hr blended against domestic US industrial IIoT consultancies at $165/hr blended. For reference, the 2025 EU average whole-economy hourly labour cost was EUR 34.9 (Eurostat lc_lci_lev).
Whether you buy or build predictive maintenance software, normalize every quote to cost per monitored asset over 36 months. It's the only number that compares across pricing models.
CTO and Co-founder at Idealogic. Directing engineering, systems architecture, security, and full-stack delivery across web, mobile, and blockchain.
Frequently asked questions
Predictive maintenance (PdM) software ingests high-frequency condition telemetry from industrial machinery (tri-axial vibration, motor current, ultrasound, bearing temperature, and oil dielectric state), extracts spectral and time-domain features at the edge, detects early mechanical or electrical degradation across the P-F interval, estimates Remaining Useful Life (RUL), and automatically dispatches parts-reserved work orders into the plant CMMS before an unplanned breakdown occurs.
Preventive maintenance (PM) services assets on fixed calendar or run-hour intervals regardless of actual health, over-maintaining healthy gear and missing mid-interval failures. Condition-based maintenance (CBM) triggers alerts when a single sensor crosses a static threshold such as ISO 20816 vibration velocity limits. Predictive maintenance (PdM) combines multi-variate operating context (load, speed, recipe) with degradation models to forecast time-to-failure weeks in advance.
ISO 13374 standardizes condition monitoring software into six sequential processing blocks: Data Acquisition (sampling raw sensor waveforms), Data Manipulation (filtering, windowing, and FFT feature extraction), State Detection (comparing features against baseline operating profiles), Health Assessment (diagnosing specific fault modes such as outer-race bearing spalling), Prognostics (projecting Remaining Useful Life), and Advisory Generation (triggering CMMS work orders and maintenance recommendations).
A single tri-axial piezoelectric accelerometer sampled at 25.6 kHz with 24-bit resolution generates roughly 230 kilobytes per second, or nearly 20 gigabytes per day per sensor. Streaming raw continuous waveforms from 150 bearings over plant Wi-Fi or cellular links saturates bandwidth and bloats cloud storage costs. Edge gateways compute RMS, kurtosis, crest factor, and FFT envelope harmonics locally, streaming compact feature vectors and burst waveforms only on anomaly triggers.
Most factories lack labeled run-to-failure datasets for their specific equipment. Effective PdM programs start in Phase 1 with physics-informed spectral rules (bearing BPFO/BPFI harmonics and ISO 20816 zones) paired with semi-supervised anomaly detection (Mahalanobis distance, Isolation Forests, or autoencoders trained on 4 to 8 weeks of healthy recipe-conditioned operation). Supervised Remaining Useful Life (RUL) models are layered in Phase 2 as technician teardown confirmations accumulate.
The P-F interval is the time window between Point P (when a developing fault first becomes detectable) and Point F (functional failure when the asset can no longer hold tolerance or stops). On a rolling-element bearing, ultrasonic acoustic emission and high-frequency demodulated vibration detect subsurface micro-spalling roughly 4 to 12 weeks before failure. Treat that as a planning range, because the real interval varies with defect type, load, and speed. Audible noise and housing heat appear only hours or days before seizure.
Raw threshold alarms fire constantly during cold startups, high-load recipes, and product changeovers, training maintenance teams to ignore the dashboard. Production PdM software suppresses false positives by joining sensor telemetry with PLC state and active recipe tags over OPC UA, requiring persistence across multiple windows, deduplicating alerts via hysteresis bands, and creating a single idempotent CMMS work order per degradation trajectory.
In 2026, engineering an owned industrial predictive maintenance stack with IEC 62541 OPC UA and MQTT Sparkplug B ingestion, C++ or Rust edge FFT envelope analysis, TimescaleDB historian storage, ONNX Remaining Useful Life scoring, and automated CMMS work-order dispatch costs $90,000 to $225,000 in Central and Eastern Europe at $75 per hour versus $198,000 to $495,000 in the US at $165 per hour, with no recurring per-sensor subscription.
Augury Machine Health bundles proprietary wireless vibration and temperature nodes with cloud diagnostics for standard balance-of-plant pumps, fans, and compressors, priced per monitored asset by quote. Falkonry, now part of IFS, applies multivariate time-series AI across existing plant historians, and Siemens Senseye provides enterprise multi-site asset health scoring. Amazon closed AWS Monitron to new customers on October 31, 2024 and retired Amazon Lookout for Equipment in October 2026. Brownfield manufacturers that want to keep their waveforms and models can move to an open IEC 62541 OPC UA and MQTT Sparkplug B edge FFT stack.
In an illustrative model of 400 critical rotating assets (motors, pumps, compressors, and CNC spindles) over 36 months, Siemens Senseye totals roughly $911,000, Falkonry totals roughly $941,000, and Augury Machine Health reaches roughly $978,000. Engineering an owned OPC UA, MQTT Sparkplug B, Rust or C++ edge FFT, TimescaleDB, and ONNX RUL platform in CEE totals roughly $338,700 all-in including $165,000 of CapEx, which saves $572,300 to $639,300 in this model. The vendor inputs are planning assumptions, because all three vendors quote per contract.
More from the journal

RFID Inventory Management Software: Architecture & 2026 Cost
How custom RFID inventory management software is architected and priced in 2026: RAIN UHF Gen2v2 physics, 96-bit GS1 SGTIN-96 serialization, Impinj and Zebra edge stray-read filtering, EPCIS 2.0 events, hardware budgets, and $45,000 to $225,000+ build tiers.

What Is a Smart Factory? IT/OT Architecture & Implementation Guide
Most Industry 4.0 pilots never scale because every machine gets its own point-to-point IT/OT connector. Here's how to architect an event-driven smart factory with a Unified Namespace, brownfield PLC gateways, and IEC 62443 network segmentation.

Deepgram vs AssemblyAI in 2026: Latency, VAD & ASR TCO
Deepgram vs AssemblyAI and OpenAI Realtime ASR in 2026, compared on engineering and 36-month TCO: Flux native End-of-Turn vs Universal-3.6 Pro Realtime, Nova-3 keyterm prompting, PII audio redaction, silence billing on streaming, Silero VAD, and L4 GPU math.